
Following on from the previous post on installing OpenVAS on a RaspberryPi I have been asked to install the Elastic Stack on a RaspberryPi 4B 4GB. Now right off the bat let me caveat what you are about to read with ‘just because you can, does not mean you should’, this was a proof of concept for an SME client who wanted a cheap way to demonstrate to management the value of log aggregation and a SIEM, there are many who don’t view the Elastic stack as a SIEM but that’s an argument for another day. The plan is to remove this and move to enterprise grade hardware in the near future.
As with the OpenVAS solution we use Kali as our operating system, because I like it. What is important this time is to ensure a non-root user is added, this is best practice anyway but some people fail to do this with Kali – though with release 2020.1 the default user is no longer root. This post assumes the reader has installed Kali, has a non-root user and has set the IP address to 192.168.1.3.
To get Elasticsearch working on ARM architecture is not the hardest part of the project, however it is not going to work by just installing a package, because there are dependencies compiled into the package that are x86 specific.
- Install Java
apt-get install openjdk-13-jre
- As the non-root user download the Elasticsearch archive, WITHOUT the bundled Java, because the bundled version does not work with ARM.
wget https://artifacts.elastic.co/downloads/elasticsearch/elasticsearch-7.5.1-no-jdk-linux-x86_64.tar.gz
wget https://artifacts.elastic.co/downloads/elasticsearch/elasticsearch-7.5.1-no-jdk-linux-x86_64.tar.gz.sha512
shasum -a 512 -c elasticsearch-7.5.1-no-jdk-linux-x86_64.tar.gz.sha512
- Extract the .tar.gz file
tar -xvf elasticsearch-7.5.1-no-jdk-linux-x86_64.tar.gz
- Machine learning is not supported on ARM hardware, edit elasticsearch.yml and set:
xpack.ml.enabled: false
- To prevent an error due to the virtual memory being too small edit /etc/sysctl.conf and add the following line:
vm.max_map_count=262144
- To test the installation, in the elasticsearch directory issue the following command:
JAVA_HOME=/usr ./bin/elasticsearch -d
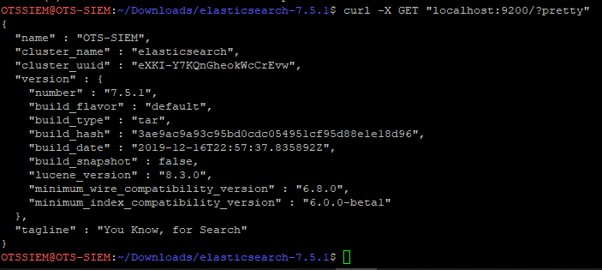
Wait a couple of minutes and then issue the following command:
curl -X GET “localhost:9200/?pretty”
- Stop the daemon using the following command:
pkill -f elasticsearch
- To get the installation visible across the network we need to edit the elasticsearch.yml file, and set the network host and the discovery seed hosts:
network.host: 192.168.1.3
discovery.seed_hosts: [“127.0.0.1”, “[::1]”]
- To test the installation, in the elasticsearch directory issue the following command:
JAVA_HOME=/usr ./bin/elasticsearch -d
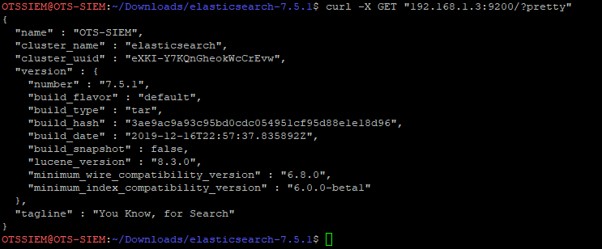
Wait a couple of minutes and then issue the following command:
curl -X GET “192.168.1.3:9200/?pretty”
- To confirm elasticsearch is available on other network nodes, on another computer on the subnet open a browser and navigate to 192.168.1.3:9200
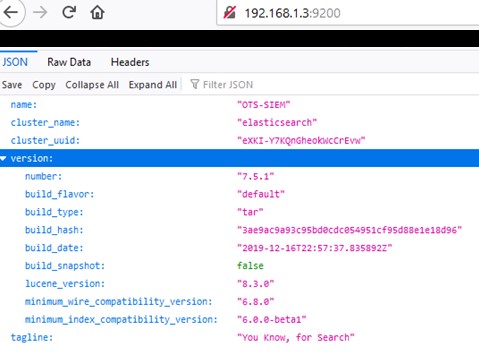
- The elasticsearch instance at this stage is not secure, there is no authentication and all traffic across the network is unencrypted, evidenced by the crossed padlock above. Edit the elasticsearch.yml file, and add the following lines:
xpack.security.enabled: true
xpack.security.http.ssl.enabled: true
xpack.security.transport.ssl.enabled: true
xpack.security.http.ssl.key: ca/ca.key
xpack.security.http.ssl.certificate: ca/ca.crt
xpack.security.http.ssl.certificate_authorities: ca/ca.crt
xpack.security.transport.ssl.key: ca/ca.key
xpack.security.transport.ssl.certificate: ca/ca.crt
xpack.security.transport.ssl.certificate_authorities: ca/ca.crt
- In the elasticsearch folder run:
JAVA_HOME=/usr ./bin/elasticsearch-setup-passwords interactive
Store the elastic, apm_system, kibana, logstash_system, beats_system, and remote_monitoring_user passwords in accordance with your Password Policy.
- Generate an SSL certificate (browsers will raise warnings for self-signed certificates), in the elasicsearch directory issue the following command:
JAVA_HOME=/usr ./bin/elasticsearch-certutil ca –pem
This creates an output file elastic-stack-ca.zip, move the zip into the elasticsearch config folder and extract it.
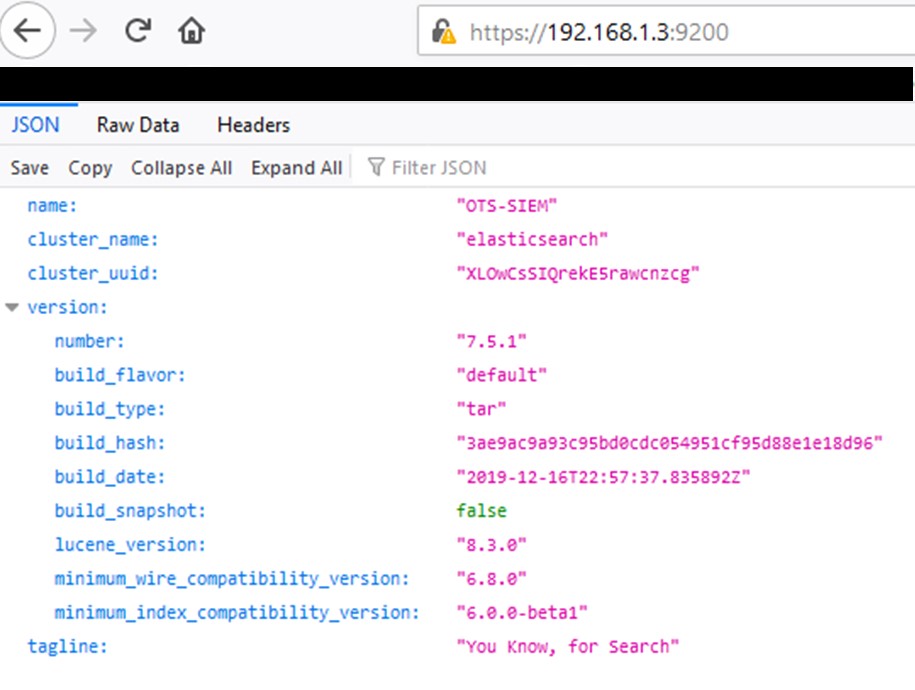
- To test the installation, in the elasticsearch directory issue the following command:
JAVA_HOME=/usr ./bin/elasticsearch -d
Wait a couple of minutes and then on another computer on the subnet open a browser and navigate to https://192.168.1.3:9200 and login as elastic using the password generated above:
- Don’t forget to edit the crontab to ensure Elasticsearch starts on reboot.
Again, to get Kibana on ARM architecture it is not just installing a package, because there are dependencies compiled into the package that are x86 specific.
- As the non-root user download the Kibana archive. Note that the latest version will probably be different from that described below – the critical thing is to ensure ALL the elements in the Elastic stack are the same version.
wget https://artifacts.elastic.co/downloads/kibana/kibana-7.5.1-linux-x86_64.tar.gz
wget https://artifacts.elastic.co/downloads/kibana/kibana-7.5.1-linux-x86_64.tar.gz.sha512
shasum -a 512 -c kibana-7.5.1-linux-x86_64.tar.gz.sha512
- Extract the .tar.gz file with the following command:
tar -xzf kibana-7.5.1-linux-x86_64.tar.gz
- The node.js instance that comes with the Kibana package does not work on ARM architecture and requires a very specific version Node.js v10.15.2.
wget http://nodejs.org/dist/v10.15.2/node-v10.15.2-linux-arm64.tar.gz
sudo tar -C /usr/local –strip-components 1 -xzf node-v10.15.2-linux-arm64.tar.gz
check that the installed version of node is correct:
node -v
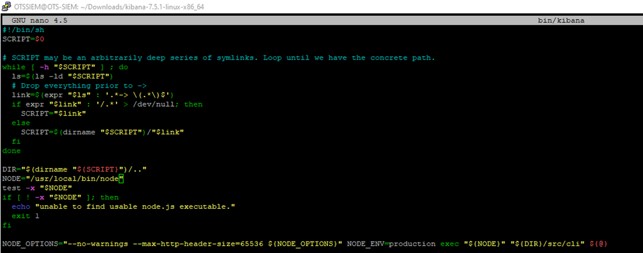
- Node.js is installed at /usr/local/bin/node, which is different to the path within the kibana script, in the kibana folder edit kibana to reflect this different location:
- This package must be held from being updated when Kali is updated:
sudo apt-mark hold nodejs
- The SSL certificates generated during the elasticsearch process must be copied into the kibana config directory.
- Edit the kibana.yml file to reflect the installation.
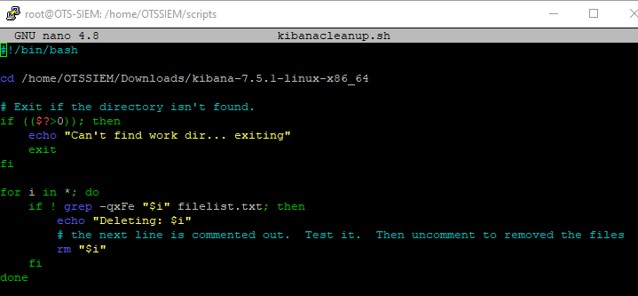
- Kibana will try to run Chrome as a headless instance, this will generate a file in the kibana root directory related to an error (because there is no Chromium browser compiled for ARM architecture), this file will then cause kibana to fail the next time it is run due to file length. Because this filename is so long it causes problems with deleting it, the solution is to list what should be in the directory and then remove everything else. In the kibana directory create a file called filelist.txt and list the files that should be in the directory (remember that Linux treats everything as a file, including directories). In the scripts directory create a file called kibanacleanup.sh
- Set the kibanacleanup.sh file to be executable and create a file called kibana.sh
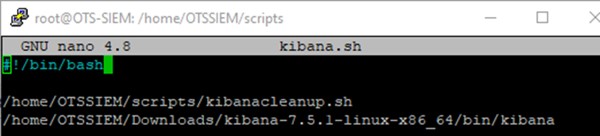
Set the kibana.sh file to be executable and run it.
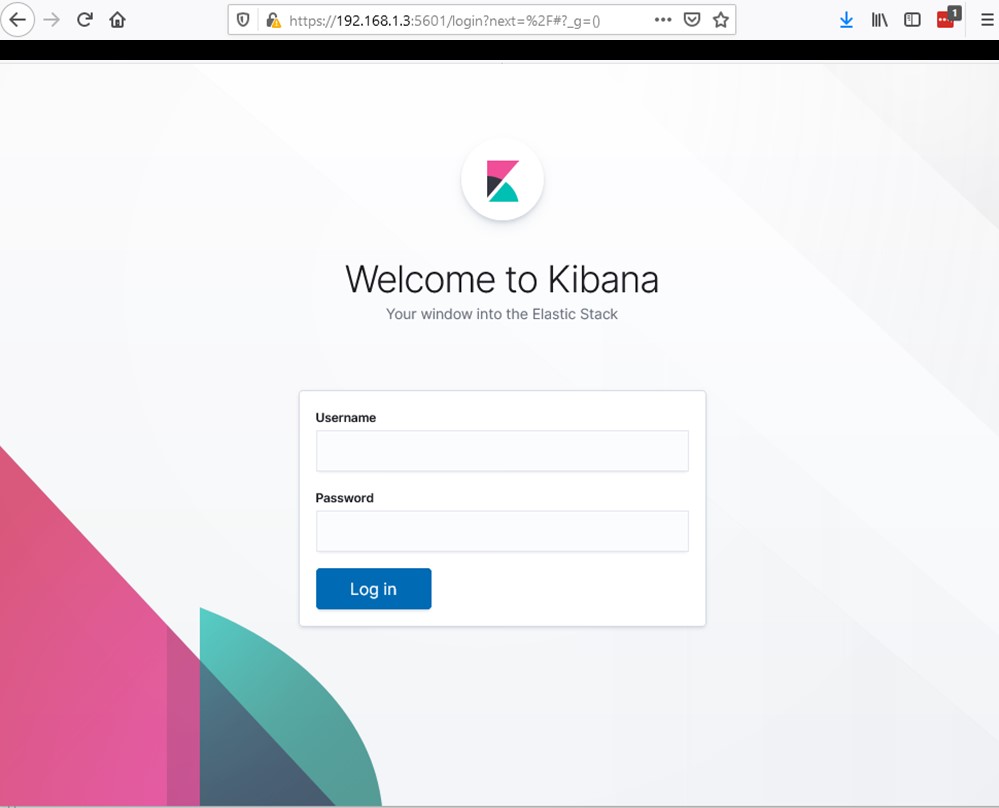
- On another computer on the subnet open a browser and navigate to https://192.168.1.3:5601 and login as elastic using the password generated above in elasticsearch.
I am not going to insult your intelligence and document how to install Winlogbeat on your Windows nodes on the network and get them passing logs back to your Elasticsearch for visualization in Kibana.
Again, not rocket science, but if you are going to run Filebeat on ARM architecture, which our Pi is, you are going to have to compile from source.
It does make sense to ship the logs from your Pi into Elasticsearch, and if you have other devices like routers and switches that support rsyslog you could make this device your rsyslog server and use it to pipe the logs from those other devices into Elasticsearch without having to install any additional software on them.
- Install go:
apt-get install golang
- Install python virtualenv:
pip3 install virtualenv
- Set the root path for Go package management:
export GOPATH=~/go
- Get sources:
go get github.com/elastic/beats
- Navigate to the beats folder:
cd ~/go/src/github.com/elastic/beats/filebeat/
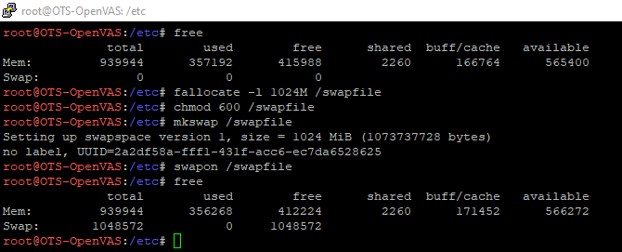
- Compiling with Go, even using a single CPU core can take a lot of memory and the Pi3 doesn’t have much, and no swap file, so make a swap file:
- Build the binary:
GOPATH=~/go make
- Edit the filebeat.yml file to collect the logs you want and to connect to your Elasticsearch instance.
- Setup filebeat:
./filebeat setup
- It is highly likely that you will need to pass the configuration file (filebeat.yml) path to filebeat when you run it using the -c flag
All that remains is to configure your Kibana canvas, but there are many guides and posts on that, so let’s not re-invent the wheel. Happy hunting.